Ads 468x60px

Sunday, November 27, 2011

NIFTY WEEKEND ANALYSIS FOR THE WEEK ENDED 26TH NOV 2011

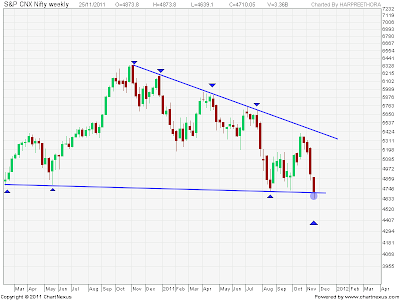
Nifty yet again started the week on a negative note and reached the lows of 4640 level, before closing near its 52 weeks low at 4710 ,a 196 points loss over previous week or nearly 4percent cut on the index.


Let us see the alignment of some of the key technical Indicators
 Ichimoku Kinko Hyo: 
Gave a sell signal last week and the price action was within the cloud and was a moderate signal but bears managed to pull the index to new lows and in the process nifty moved below the cloud making the sell stronger, the early signs of any reversal in the trend would be only on a close above the conversion line which is near 4887 level.


Bollinger Band:this is the third straight time when the prices have been rejected above the mid of the weekly bollinger charts and moved down to test the lower band. which is sub 4600 level for the week

 
NIFTY support and resistance
From the up move to the high of 6339 to a low of 4640 nifty is moving in a narrowing formation, the current formations looks like a triangle , nifty is likely to continue withing this formatio for some more time, however a breakout/down from the range will decide the further direction on the index.Nifty broke the channel but managed to close the week above the trend line. if the index manages to stay above this trend line then this likely false breakdown will help index breakout from the channel,however if the trend-line is broken then the bear party would continue for long.
   
 
38 DAY EMA :  This moving average has been successively giving good trades throughout the year 2011,gave yet another 500 points move, the stochastics has been showing oversold condition for some time now and any bounce from here would give another selling opportunity.
FIBONACCI RETRACEMENT LEVELS
Fibonacci retracement levels from a fall from 5400-4640 level, indicated immediate resistance at 23% at 4819 level and 38% at 4930 level l.
       
 FIBONACCI EXTENSION:
Nifty retraced more then 100 of the rise from 4720-5400 level, only a  move past 4865 would change the short term trend in favor of the bulls, however fail to stay above 4742 level would see nifty falling to 4560 or 123% followed by 138% at 4460 levels.


NIFTY STOCHASTIC AND MACD:
MACD has started to show reversal signs indication a short trem bottom is in place at 4640 level

The Stochastic has also reached the oversold territory, and a technical bounce either in form of flat correction or until the stochastic reading starts indication of overbought zone this looks like a pause in the down move for the moving averages to catch up the price action.
 PREVIOUS WEEK:
 The trade setup last week  enabled us to book part profits near 4676 levels, and aggressive longs taken around this level should be managed with proper trailing stop-loss.


THE WEEK AHEAD: Holiday season which is set to reduce the volumes in all markets and heavy sell-off by the FII;s in cash and futures are not very encouraging signs for the bulls and any rally from here on would be sold-off.
Expected High /Low for the week 4791.5-4557.5with 4740 being the pivot point for the week, positions taken near these levels would give good trades for the week. buying near 4560-75 levels with SAR below 4545 level and taking short positions near 4780-95 with SAR above 4820 level should be the strategy for traders with no position, those who part booked at 4676 level should reenter shorts around the above levels.


HAPPY TRADING!!!!!!!!!

NIFTY GMMA UPDATE 10%+ returns


BUZZING NIFTY : GMMA  UPDATE


 The indicator gave returns of more then 12.5% on the index after we spotted the formation.


pls refer the earlier post where the formation was spotted in the  WEEKEND ANALYSIS
 http://buzzingnifty.blogspot.com/search/label/GMMA

Monday, November 21, 2011

NIFTY WEEKLY TRADE SETUP

PREVIOUS WEEK: The week was as per the plan , we got thee trades .First trade sold around 5230 was covered at 5070 giving good 160 points profit, second trade was stopped out at 15 points loss, bought at 5070points and stopped and reversed at 5055 and the third trade gave us another 155 points as nifty after slipping below 4850 level managed to close near 4900 level. This week again we cover the entire move for the week. with 290 points profit ofr the week

THE WEEK AHEAD:With nifty near the bottom of the range of 4720-5160, gave a false break out by moving past 5350 level is now back in the range buying near supports and selling near the resistance has given good profits, only a break of the range would give a larger trade setup.

Expected range for the week 4676 -5068, trades taken near these levels would give good trade setups.
For the conservative traders Buying near 4670-85 with SAR below 4660 and selling near 5060-70 with SAR above 5080 should be the strategy 
For aggressive traders Sold below 5040 with SAR above 5130

HAPPY TRADING!!!!!!!!!

Sunday, November 13, 2011

NIFTY WEEKEND ANALYSIS for the week ended 11TH NOV 2011


Uncertainty over European crisis and downgrade of Indian banking industry rating by moody's, saw nifty testing the breakout range, which was achieved after a consolidation of more then 10 weeks. Nifty closed the week at 5168 nearly 114 points, roughly 2% lower then previous week close of 5284


Let us see the alignment of some of the key technical Indicators
 Ichimoku Kinko Hyo: 

Ichimoku gave a buy signal  near 5040 level on 18th oct, during the week nifty after trading above the cloud moved back in the cloud below 5220, still in buy mode but the bulls are fast loosing the strength and a break below the base line at 5064 would favor the bears.
BUZZING NIFTY: ICHIMOKU KINKO HYO

Bollinger Band: Nifty  tested  the top of the band  moved down, on Friday nifty closed below  the rising  mid of the band around 5180 level.Price behaviour in Nifty during the first week of Nov suggested that the short term top is in place and correction/consolidation is in process.

BUZZING NIFTY: DAY BOLLINGER

WEEKLY BOLLINGER BAND: In the weekly charts Nifty is rising from the bottom of the band, mid of the BB of the week is roughly around 5180 level and previous week close was rejected at the mid of the band, a break below the mid of the band on closing basis has turned the tide in favor of the bears.
BUZZING NIFTY: WEEKLY BOLLINGER BAND
 NIFTY MOVING IN A CHANNEL
From the up move to the high of 6339 to a low of 4720 nifty is moving in a channel, giving good trades, nifty after touching the lower end of the channel at 4720 level rose sharply but failed to test the upper resistance line near 5470 level and started moving down after a big gap up opening near 5400 level, if fail to cross the resistance it would be heading toward making a newer low on the Index.
   
BUZZING NIFTY: NIFTY CHANNEL


38 DAY EMA :  This moving average has been successively giving good trades throughout the year 2011,(chart1)
BUZZING NIFTY: PRICES ABOVE 38DEMA


BUZZING NIFTY: PRICE NEAR 38DEMA
the 2nd chart shows when ever the price have moved below the moving average good shorting opportunity is presented in Nfity giving fabulous returns.

NIFTY  SHORT TERM CHANNEL
The last up-move of nifty is in a channel and a break of the channel indicated early signs of change in the trend.(chart 1)
BUZZING NIFTY:NIFTY CHANNEL SHORT TERM
in the 2nd chart as can be seen looks like another channel is forming  and can be termed as consolidation/correction of the up-move from 4720-5400 level
BUZZING NIFTY:NIFTY CHANNEL SHORT TERM

NIFTY FIBONACCI RETRACEMENT:
BUZZING NIFTY: FIBONACCI RETRACEMANT
Nifty retraced 38.2% of the up-move from 4720-5400 @5143 level if able to sustain above this the next leg up might unfold in coming weeks. however if nifty slips below this level it might target 50% at 5064 and 61.2% at 4985, below this nifty would be in total control of the bears.


 NIFTY RE TEST OF THE BREAKOUT LEVEL/POSSIBLE FALSE BREAKOUT:
Nifty is back at the previous resistance level of 5130-65 which was also the top of the range which was broken after 10 weeks.
BUZZING NIFTY:RE-TEST OF CHANNEL
5168 which is also the pivot for Monday holds the key for the next week, if manage to stay above the trend line may continue the journey north , but the break of this level will put the bal again in the bears camp who wont miss any trick to break the previous lows of 4720 level.


NIFTY - GMMA
THE MULTIPLE MOVING AVERAGE :
the price behavior suggest that when ever the smaller moving averages have crossed the larger once after contracting the index has fallen more then 10%, will this happen this time around as well???
BUZZING NIFTY: GMMA


PREVIOUS WEEK: The week was as per the plan as suggested to sell near 5310-15 level, the high made during the week was 5317, those who traded as per the plan earned good 140 points and could cover the entire move for the week

THE WEEK AHEAD:With nifty back in the  range buying near supports and selling near the resistance has given good profits, only a break of the range would give a larger trade setup, until the range is resolved trade light and book smaller profits.

Expected range for the week 5068-5243, trades taken near these levels would give good trade setups.
For the conservative traders Buying near 5070-80 with SAR below  5055 and selling near 5235-40 with SAR near 5250 should be the strategy 
For aggressive traders Buying above 5070 with SAR below 5040 would yield good returns
Levels to watch till the range is resolved and a clear trend emerges 5068-5099-5105-5143-5168-5220- 5242


HAPPY TRADING!!!!!!!!!

Tuesday, November 8, 2011

NIFTY WEEKEND ANALYSIS for the week ended 05TH NOV 2011

Nifty broke the range of 5040-5160 and moved up-to 5400 and developed a new range in earlier support zone of 5370-5220 a decisive break of this range is likely to give good direction to Nifty.


Let us see the alignment of some of the key technical Indicators
 Ichimoku Kinko Hyo: 
Ichimoku gave a buy signal  near 5040 level, during the previous week nifty traded above the cloud making the buy signal stronger, the first sign of weakness would be only on price entering the cloud near 5220 level for the week.
The circles marked dark blue show that nifty is currently getting support at the conversion line nearly 5240 level.


Bollinger Band: Nifty  tested  the top of the band  and has started to move down again,  strength remains as long as nifty trades above the rising  mid of the band around 5150 level.
Price behaviour in Nifty suggest that the short term top is in place and correction/consolidation is in process.


WEEKLY BOLLINGER BAND: In the weekly charts Nifty is rising from the bottom of the band, mid of the BB of the week is roughly around 5200 level and previous week close was supported at the mid of the band, a break below the mid of the band on closing basis would turn the tide in favor of the bears.

NIFTY MOVING IN A CHANNEL
From the up move to the high of 6339 to a low of 4720 nifty is moving in a channel, giving good trades, nifty after touching the lower end of the channel at 4720 level rose sharply but failed to test the upper resistance line near 5470 level and started moving down after a big gap up opening near 5400 level, if fail to cross the resistance it would be heading toward making a newer low on the Index.
   
BUZZING NIFTY: NIFTY CHANNEL
  
38 DAY EMA :  This moving average has been successively giving good trades throughout the year 2011,only a comfortable move past 5020 level has add strength to the BULLS
BUZZING NIFTY: PRICES ABOVE 38DEMA


NIFTY  SHORT TERM CHANNEL
The current up-move of nifty is in a channel and a break of the channel would show early signs of change in the trend the support of nifty is near 5260 level and resistance is near 5493 levels.

NIFTY 50,100&200 SMA:
Nifty staying above 50and 100 DMA and almost tested its 200 DMA at 5416 odd levels, the chart suggest that the price action in previous occasions have failed to move above 200DMA and is likely to act as a resistance this time around as well. the support of 100 DMA comes around 5240 level.


 NIFTY BUMP AND RUN REVERSAL:
Nifty broke the down trend and the chart pattern suggest a reversal in Nifty, price staying above the trend line favors bulls
BUZZING NIFTY:BUMP AND RUN REVERSAL

THE WEEK AHEAD:With nifty trading in a narrow range buying near supports and selling near the resistance has given good profits, only a break of the range would give a larger trade setup, until the range is resolved trade light and book smaller profits.

Expected range for the week 5163-5322, trades taken near these levels would give good trade setups.
Buying near 5170-75 with SAR at 5160 and selling near 5310-15 with SAR near 5330 should be the strategy for the conservative traders
Levels to watch till the range is resolved and a clear trend emerges 5260-5299-5330

HAPPY TRADING!!!!!!!!!

Popular Posts

NIFTY STOP AND REVERSE TRADING STRATEGY

NIFTY SAR(STOP AND REVERSE) FOR THE NEXT DAY IS POSTED ON DAILY BASIS ON FACEBOOK GROUP NIFTYHOLIC.

ALL VALUES ARE FOR SPOT NIFTY, TRADE THE FUTURES ACCORDINGLY

SAMPLE SAR

NIFTY SAR FOR 23RD MARCH 2011

SAR FOR 23RD MARCH,

SELL NIFTY BELOW 5405 AND GO LONG ABOVE 5430

IF HOLDS ON CLOSING BASIS

...

LAST TRADE

PART BOOKED @5385=120 POINTS OR 6000 RS.

CLOSED THE POSITION ON 22ND MARCH @5405=100 POINTS OR 5000 RS.

TOTAL PROFIT IN LAST TRADE WITH 2 LOTS=11000/-

AS ON 22ND MARCH

NIFTY RANGE FOR THE MARCH SERIES 5214.38 -- 5613.32

PCR INDEX OPTIONS-- 1.13(BEARISH)

INDIA VIX --22.26

SMR(smart Money Ratio)=16.73053(Bearish)


DISCLAIMER

Any action you choose to take in the markets is totally your own responsibility. Buzzingnifty™ will not be liable for any, direct or indirect, consequential or incidental damages or loss arising out of the use of this information. The services are based on technical analysis. They are neither an offer to sell nor solicitation to buy any of the securities mentioned herein. The writers may or may not be trading in the securities mentioned.