Nifty started the week on a positive note and moved up-to 5168, but faced stiff resistance at previous weeks high of 5169 and 5143 resp, on Thursday nifty faced the wrath of the bears and fell more then 4%, the biggest rally since 2008 recovery, Thanks to negative global clues, appreciation in USD against INR, high inflation, PC's name in 2G scam, FII's continued sell offs. All teaming up together to bring nifty near 52 weeks low
Let us see the alignment of some of the key technical Indicators
Elliot Wave Count:
The complicated wave 4, as it is well known to give a false breakout before resuming the actual trend, possibly gave a false breakout in the form of Triangle posted last week, early indications of 5th impulsive down is a break of 5880, However if the lows of Friday are not breached in the early half of the week, we could see some corrective up-moves for the week in the form of sub waves of larger 5th wave.
 |
| BUZZING NIFTY: ICHIMOKU BUY |
 |
| BUZZING NIFTY: DAY BOLLINGER BAND |
In the weekly chart the prices rose from the bottom of the bollinger band, but failed to test the mid BB and the big red candle on the chart is not very encouraging either, immidiate support is seen at 4742 level and only a close above mid of BB which is roughly at 5307 would change the midterm trend for nifty.
 |
| BUZZING NIFTY: WEEKLY BOLLINGER BAND |
NIFTY MOVING IN A CHANNEL
From the up move to the high of 6339 to a low of 4720 nifty is moving in a channel, giving good trades, nifty after touching the lower end of the channel at 4720 level moved up , but the bears are active and pulling it back to the bottom of the channel currently near 4612 level.
 |
| BUZZING NIFTY: NIFTY CHANNEL IN DAY CHART |
38 DAY EMA : This moving average has been successively giving good trades throughout the year 2011, previous Friday nifty failed to move past this all important MA and started another round of sell off.
This time was no exception and nifty found resistance at the same MA , and the bears did not miss the trick this time around and pulled nifty far away from this important indicator.
 |
| BUZZING NIFTY: 38DEMA FAVORING BEARS |
FIBONACCI RETRACEMENT LEVELS
Fibonacci retracement levels from a fall from 5740-4720 level, indicated last week, in the last week nifty moved below 23% retracement clearly indicating weakness.
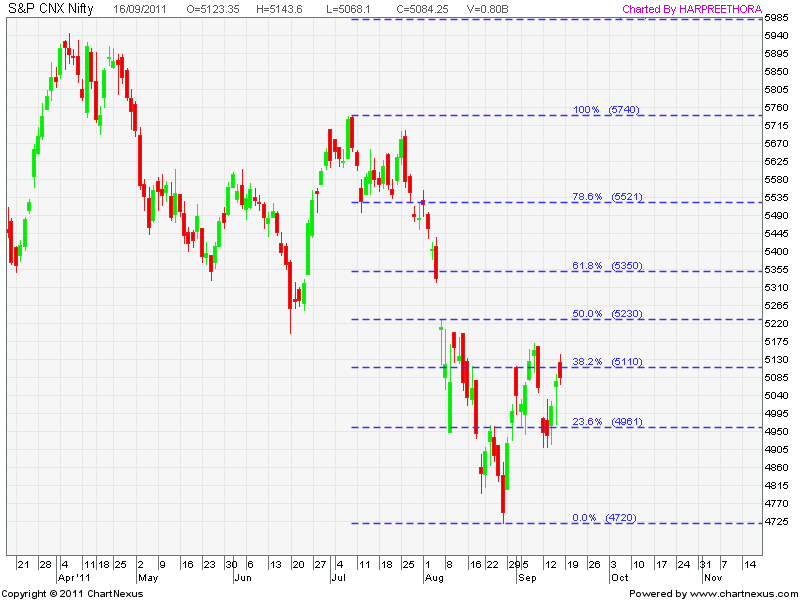 |
| BUZZING NIFTY: FIBO LEVELS |
INVERTED BUMP AND RUN POSSIBLE FORMATION
 |
| BUZZING NIFTY : INVERTED BUMP AND RUN |
The current setup in nifty suggest the formation of the inverted bump and run pattern , however this is very initial stage, but lets try to keep a watch on the possible formation and how the prices unfolds, a break above the current trend line would be the ray of hope for the bulls.
NIFTY LONG TERM CHART
Nifty is trading near the support as indicated in the chart, the trend line is drawn from the panic lows of 2008, a break below this trend line would be the real worry for long term investors, also the channel indicates the current down phase in the nifty, in both the cases a break above the resistance line would see nifty flying high to make newer and bigger top.
 |
| BUZZING NIFTY: NIFTY LONG TERM CHART |
The week ahead: With a lot of negative news in the market, higher inflation, appreciation in USD the equity / commodity markets globally are under continued pressure, nifty is now trading below the earlier supports of 4911 and 4943 levels and will now turn into resistance, and only a move past these levels will see some short covering, as we are in the last week of the Sept contract expiry, and markets trading well below all moving averages, and Pivots, expecting more pain to the bulls
Remember the long/mid term trend of nifty is down, but the short term is over sold and can stay like this for more time, however it can bring some sharp intraday rallies which can be used to create fresh short position for the week.
HAPPY TRADING!!!!!!!!!
.png)


No comments:
Post a Comment