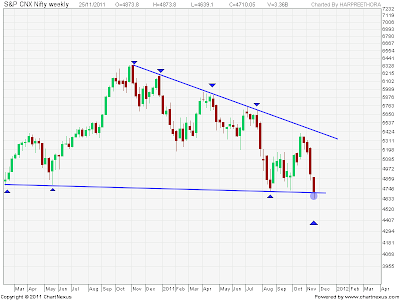
Nifty yet again started the week on a negative note and reached the lows of 4640 level, before closing near its 52 weeks low at 4710 ,a 196 points loss over previous week or nearly 4percent cut on the index.
Let us see the alignment of some of the key technical Indicators
Ichimoku Kinko Hyo: Gave a sell signal last week and the price action was within the cloud and was a moderate signal but bears managed to pull the index to new lows and in the process nifty moved below the cloud making the sell stronger, the early signs of any reversal in the trend would be only on a close above the conversion line which is near 4887 level.
NIFTY support and resistance
From the up move to the high of 6339 to a low of 4640 nifty is moving in a narrowing formation, the current formations looks like a triangle , nifty is likely to continue withing this formatio for some more time, however a breakout/down from the range will decide the further direction on the index.Nifty broke the channel but managed to close the week above the trend line. if the index manages to stay above this trend line then this likely false breakdown will help index breakout from the channel,however if the trend-line is broken then the bear party would continue for long.
38 DAY EMA : This moving average has been successively giving good trades throughout the year 2011,gave yet another 500 points move, the stochastics has been showing oversold condition for some time now and any bounce from here would give another selling opportunity.
FIBONACCI RETRACEMENT LEVELS
Fibonacci retracement levels from a fall from 5400-4640 level, indicated immediate resistance at 23% at 4819 level and 38% at 4930 level l.
Nifty retraced more then 100 of the rise from 4720-5400 level, only a move past 4865 would change the short term trend in favor of the bulls, however fail to stay above 4742 level would see nifty falling to 4560 or 123% followed by 138% at 4460 levels.
MACD has started to show reversal signs indication a short trem bottom is in place at 4640 level
The Stochastic has also reached the oversold territory, and a technical bounce either in form of flat correction or until the stochastic reading starts indication of overbought zone this looks like a pause in the down move for the moving averages to catch up the price action.
PREVIOUS WEEK:
The trade setup last week enabled us to book part profits near 4676 levels, and aggressive longs taken around this level should be managed with proper trailing stop-loss.
THE WEEK AHEAD: Holiday season which is set to reduce the volumes in all markets and heavy sell-off by the FII;s in cash and futures are not very encouraging signs for the bulls and any rally from here on would be sold-off.
Expected High /Low for the week 4791.5-4557.5with 4740 being the pivot point for the week, positions taken near these levels would give good trades for the week. buying near 4560-75 levels with SAR below 4545 level and taking short positions near 4780-95 with SAR above 4820 level should be the strategy for traders with no position, those who part booked at 4676 level should reenter shorts around the above levels.
HAPPY TRADING!!!!!!!!!


.png)


1 comment:
• Mistry hints at huge impairments of $18 billion for Tata group
• Dr Reddy's Labs enters into collaboration with Gland Pharma
• Hero Motocorp to invest Rs205 crore in Ather Energy
CapitalStars
Post a Comment