Ads 468x60px

Showing posts with label 9RSI. Show all posts

Thursday, December 15, 2011

NIFTY BULLISH FALLING WEDGE IN HOUR CHART/ POSITIVE DIVERGENCE

Nifty bullish falling wedge formation in hourly charts, the support comes near 4650 odd levels, a break above 4774 would confirm short term reversal on the index, might target 5090-5100 odd level.
Price behavior in nifty suggest another bullish possibility in the form of positive divergence in both MACD and 9RSI, if nifty manages to hold on to the support line indicated in the above chart, these divergence would ensure a good run for the bulls at-least in short term.

Nifty is holding the current lows also favors the possiblity of Gartley pattern in day chart posted earlier
refer link.
http://buzzingnifty.blogspot.com/2011/12/nifty-trade-setup-for-week-12-17dec.html

Saturday, October 15, 2011

NIFTY WEEKEND ANALYSIS for the week ended 14TH OCT 2011

Nifty started the week with good strong rally on Monday and continued its journey north and closed near weekly high at 5132, a gain of good 246 points or 5% gains for the index.  Long legged doji or a pinhead  formed last week was followed up by a strong bull candle indicating initial signs of reversal from the lows of 4720. The current setup looks like a double bottom formation on the weekly charts.


Let us see the alignment of some of the key technical Indicators
 Ichimoku Kinko Hyo: 
Ichimoku continue to be in sell mode but the price action is turning things around in the favor of the bulls, during the week nifty cleared the hurdles of Tanken sen, Kijun sen and the Komu, the prices have entered the cloud, the indicator will soon turn to buy mode and if the prices manage to clear the cloud this would be a strong buy
BUZZING NIFTY: ICHIMOKU KINKO HYO


Bollinger Band: Nifty started to rise from the lower BB and climbed above mid BB and nearing top of the band at 5201 odd level, how ever the previous two attempts have failed even to test the top of the band, in the weekly charts the immediate resistance is the mid of BB at 5275 odd level.


BUZZING NIFTY: BOLLINGER BAND

 
NIFTY MOVING IN A CHANNEL
From the up move to the high of 6339 to a low of 4720 nifty is moving in a channel, giving good trades, nifty after touching the lower end of the channel at 4720 level is now moving north and would be targeting 5470 odd levels.
   
BUZZING NIFTY: NIFTY CHANNEL
  
NIFTY RESISTANCE:
Nifty has reached the resistance line and previous two close despite showing strength have failed to clear the resistance
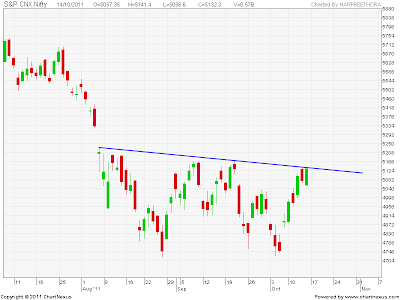
BUZZING NIFTY: NIFTY RESISTANCE
38 DAY EMA :  This moving average has been successively giving good trades throughout the year 2011,only a comfortable move past 5020 level has add strength to the BULLS
BUZZING NIFTY: PRICES ABOVE 38DEMA

FIBONACCI RETRACEMENT LEVELS
Fibonacci retracement levels from a fall from 5740-4720 level, price moved above 38% retracement the next hurdle would be to cross the 50% level at 5213 and above that is the unfilled gap Zone.
BUZZING NIFTY: FIBONACCI RETRACEMENT PRICE ABOVE 38.2%

SHORT TERM FIBO extension:
Nifty got resisted at 61.8% of the fall from 5035-4727 level, a move past 5035 has change the short term trend in favor of the bulls, nifty cleared the 123% mark at  5107 level and is likely to target 5152,5188 and 5224 levels
BUZZING NIFTY: FIBONACCI EXTENSION OF NIFTY


NIFTY BULLISH FALLING WEDGE:chart updated till previous week nifty already made good move past the wedge resistance line
Nifty is moving in a falling wedge pattern which is a bullish reversal pattern if formed at the bottom of the price action,  the breakout above 4917 are early indications of the change in trend in favor of the bulls, 
BUZZING NIFTY: NIFTY BULLISH FALLING WEDGE


NIFTY- 9RSI SIGNALS: charts updated till previous week, the setup has worked well till now
BUZZING NIFTY: 9RSI--NIFTY PRICE BEHAVIOR

 9RSI- a tool to analyze oversold/overbought conditions besides showing relative strength, has been giving good trade setups and early indications of larger moves in the making, the chart shows  some instances where NIFTY--9RSI have given good setups marked as 1(1A-1B) 2(2A-2B) AND 3MARKED AS 3A&3B
  1. In the 1st instance when nifty made lower lows the RSI made higher lows, indicating higher relative strength and resulting in higher high in Nifty.
  2. In the 2nd instance when nifty managed to make the 2nd top at 5700 odd level, the RSI made a lower top indicating relative weakness and nifty fell on to make newer 52 week low.
  3. In the 3rd instance marked as 3A&3B show  that nifty almost reached its 52 week low (4720 {3A}-4727{3B}) the 9RSI has managed lower lows and turned up on Friday, can this setup manage to give strength to the Bulls this time around ????? the price action would have to confirm this by moving above the channel.
NIFTY 20,50 100 SMA:
Nifty closed above 20 and then moved on to close above 50 SMA , may now target 100 SMA @ 5278 odd level 
BUZZING NIFTY : NIFTY ABOVE 50SMA


 NIFTY BUMP AND RUN REVERSAL:
Nifty broke the down trend and the chart pattern suggest a reversal in Nifty, price staying above the trend line favors bulls
BUZZING NIFTY:BUMP AND RUN REVERSAL


THE WEEK AHEAD: Global market turned from the bottom and gaining good ground, the Indian markets too rallied and if Nifty manages to stay above the  current levels, can target the gap area soon, any correction up-to 5020(support area of 50 SMA and 38dEMA) level should be used to create fresh long positions in the index, below 4997 nifty will resume the downtrend and this up-move would then be termed as  false breakout from the range
Expected High /Low for the week5226- 5007, positions taken near these levels would give good trades for the week.
With expiry nearing the corner, markets tend to give more pains to the trades which are already in pain, the current setup looks like the pain is only going to increase for the short trades.
Option open interest shows a range of 4900-5200 for the current expiry

HAPPY TRADING!!!!!!!!!

Saturday, October 8, 2011

NIFTY WEEKEND ANALYSIS for the week ended 08TH OCT 2011

Nifty yet again started the week on a negative note and reached the lows of 4720, but managed to protect the lows and the pressure continued, with holiday on Thursday and global negative clues saw nifty closing near its 52 weeks low, good rally in global markets on Thursday lead to a sharp gap-up opening on  Friday (with limited price action during the day, nifty  close at 4888 , 14 points gain over previous week, making a long legged doji or a pinhead in the process. Moody,s downgrading of top banks added to the pressure and bankex showed bigger losses as compared to Nifty


Let us see the alignment of some of the key technical Indicators
 Ichimoku Kinko Hyo: 
Gave a sell signal at the start of the week, this is a strong signal as the price action is well below the cloud, Friday close above the Conversion line gave some hopes for the bulls.
Any upmove from here would face resistance at the cloud( Komu) at 5036-67 levels
BUZZING NIFTY: ICHIMOKU KINKO HYO SELL


Bollinger Band: Nifty started to rise from the lower BB and would gain momentum only on a close above the mid BB currently at 4972 odd level
BUZZING NIFTY: BOLLINGER BAND

 
NIFTY MOVING IN A CHANNEL
From the up move to the high of 6339 to a low of 4720 nifty is moving in a channel, giving good trades, nifty after touching the lower end of the channel at 4720 level is now moving north and would be targeting 5550 odd levels.
   
BUZZING NIFTY: NIFTY CHANNEL
  
NIFTY BEARISH FLAG:
Nifty has formed a bearish flag, the price action has also formed a channel a break from the range will give a clear larger direction to nifty, however a break down of the channel is the preferred view, the bearish flag pattern will then have a target of the length of the pole, a good 1000 point fall on the Nifty.
BUZZING NIFTY: BEARISH FLAG


38 DAY EMA :  This moving average has been successively giving good trades throughout the year 2011,only a comfortable move past 5020 level would add strength to the BULLS
BUZZING NIFTY: 38DEMA

FIBONACCI RETRACEMENT LEVELS
Fibonacci retracement levels from a fall from 5740-4720 level, indicated immediate resistance at 4952 and 5110 level and the next hurdle would be to cross the 50% level at 5230 and above that is the unfilled gap Zone.

BUZZING NIFTY: FIBONACCI RETRACEMENT

SHORT TERM FIBO PROJECTION:
Nifty got resisted at 61.8% of the fall from 5035-4727 level, a move past 5035 would change the short term trend in favor of the bulls, however fail to stay above 4917 level would encourage the bears to pull Nifty down again to the lows of 4720 level

BUZZING NIFTY: NIFTY SHORT TERM FIBONACCI EXTENSION


NIFTY BULLISH FALLING WEDGE:
Nifty is moving in a falling wedge pattern which is a bullish reversal pattern if formed at the bottom of the price action, watch for the breakout above 4917  for early indications of the change in trend in favor of the bulls, a fail to cross 4917 level would lead nifty to the bottom of the wedge making newer lows before the bullish breakout.
BUZZING NIFTY: NIFTY BULLISH FALLING WEDGE


NIFTY- 9RSI SIGNALS
BUZZING NIFTY: 9RSI--NIFTY PRICE BEHAVIOR

 9RSI- a tool to analyze oversold/overbought conditions besides showing relative strength, has been giving good trade setups and early indications of larger moves in the making, the chart shows  some instances where NIFTY--9RSI have given good setups marked as 1(1A-1B) 2(2A-2B) AND 3MARKED AS 3A&3B
  1. In the 1st instance when nifty made lower lows the RSI made higher lows, indicating higher relative strength and resulting in higher high in Nifty.
  2. In the 2nd instance when nifty managed to make the 2nd top at 5700 odd level, the RSI made a lower top indicating relative weakness and nifty fell on to make newer 52 week low.
  3. In the 3rd instance marked as 3A&3B show  that nifty almost reached its 52 week low (4720 {3A}-4727{3B}) the 9RSI has managed lower lows and turned up on Friday, can this setup manage to give strength to the Bulls this time around ????? the price action would have to confirm this by moving above the channel.
 THE WEEK AHEAD: Global market turned from the bottom and gaining good ground, the Indian markets missed out for a day due to Holiday and would sooner or later cover up the lost opportunity, Moody's downgrading of global Financial Institutions has shown the pressure  but the other sectors have managed to keep the index up and the Financial sectors are to be watched for further Strength/ weakness

Expected High /Low for the week 5002-4808, positions taken near these levels would give good trades for the week


HAPPY TRADING!!!!!!!!!

Popular Posts

NIFTY STOP AND REVERSE TRADING STRATEGY

NIFTY SAR(STOP AND REVERSE) FOR THE NEXT DAY IS POSTED ON DAILY BASIS ON FACEBOOK GROUP NIFTYHOLIC.

ALL VALUES ARE FOR SPOT NIFTY, TRADE THE FUTURES ACCORDINGLY

SAMPLE SAR

NIFTY SAR FOR 23RD MARCH 2011

SAR FOR 23RD MARCH,

SELL NIFTY BELOW 5405 AND GO LONG ABOVE 5430

IF HOLDS ON CLOSING BASIS

...

LAST TRADE

PART BOOKED @5385=120 POINTS OR 6000 RS.

CLOSED THE POSITION ON 22ND MARCH @5405=100 POINTS OR 5000 RS.

TOTAL PROFIT IN LAST TRADE WITH 2 LOTS=11000/-

AS ON 22ND MARCH

NIFTY RANGE FOR THE MARCH SERIES 5214.38 -- 5613.32

PCR INDEX OPTIONS-- 1.13(BEARISH)

INDIA VIX --22.26

SMR(smart Money Ratio)=16.73053(Bearish)


DISCLAIMER

Any action you choose to take in the markets is totally your own responsibility. Buzzingnifty™ will not be liable for any, direct or indirect, consequential or incidental damages or loss arising out of the use of this information. The services are based on technical analysis. They are neither an offer to sell nor solicitation to buy any of the securities mentioned herein. The writers may or may not be trading in the securities mentioned.