Ads 468x60px

Showing posts with label ELLIOT WAVE. Show all posts

Monday, December 19, 2011

NIFTY WEEKEND ANALYSIS FOR THE WEEK ENDED 16th DEC 2011


Nifty started the week with a gap up opening ut was unable to sustain the above it for long and the sharp rally on Friday shattered the hopes of the bulls, and nifty closed at its 52week low, the broader market suggest that the bottom is still to be achieved.

Nifty closed the week with 215 points loss over the previous week or 4.4% down


Let us see the alignment of some of the key technical Indicators
 Ichimoku Kinko Hyo: 
Still in sell mode and the price is below the conversion line , base line and the cloud showing the weakness in the market.

Bollinger Band:Nifty closed at 52weeks low and is currently at the bottom of the band in day/week and monthly chart, but the band has just started to expand in day chart which indicates that more low are possible on the index, the first task for the bulls to achieve is pulling nifty near mid of the band in day chart.
 
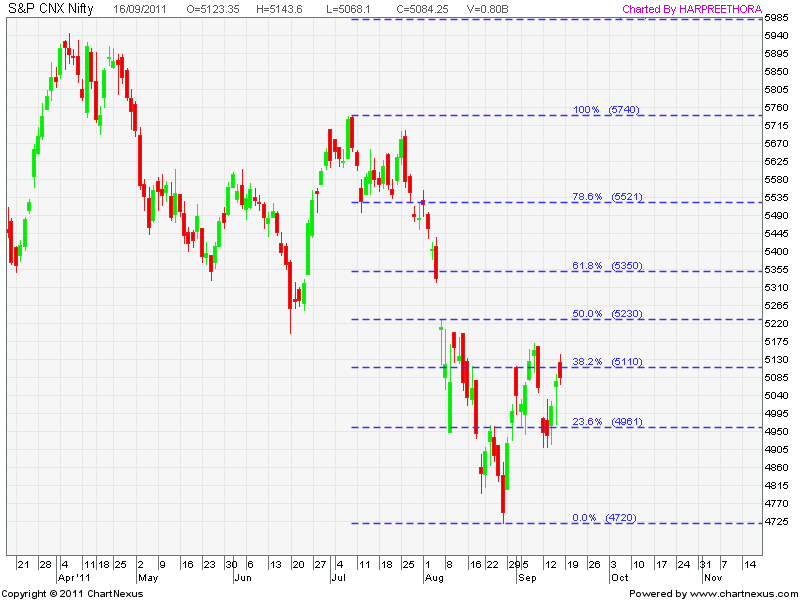
NIFTY support and resistance
Currently there are two channels in Nifty.
   The first chart shows the larger channel from the top at 6339 level, through out the year, price action has been within this channel, and currently the index is near the bottom of the channel, and is likely to give another good trade setup as the bulls would like to defend the channel, and the bears would be hoping to break-down from the channel,good positional trades can be taken with small stop-loss in either direction at the bottom of the channel.
  38 DAY EMA :  This moving average has been successively giving good trades throughout the year 2011, is trading in symmetrical patterns through out the year and this time also the price gets rejected in the first attempt to conquer 38DEMA and has give yet another good short trade.
The second channel is formed within the bigger channel and in line chart it indicates the bottom of the channel, it also give an idea about the EW typical 4th wave false break-out, and the swiftness in the fall suggest that nifty could be in the 5th wave of the fall.


NIFTY HEAD AND SHOULDER FORMATION:
a good head and shoulder is formed in the Nifty, the first chart shows the good formation
 

the line chart suggest that the neak line is broken, however in recent past the pattern has not achieved the desired results due to high popularity and wide use, keep an eye on the price action as it unfolds as it is likely to trap the weaker bears and also the newer entrants
the second charts shows the possible target of the H&S pattern. the length of the Head was 638 points and thid could be the most obvious target for the pattern, the neck line was broken near 4688 level so the target would be near 4050 level, but it is advisable to use Fibonacci levels to part book shorts and to make reentry at the resistances as they are formed.

 NIFTY POSSIBLE ROUNDING TOP FORMATION:
A chart pattern used in technical analysis which is identified by price movements that, when graphed, form the shape of an upside down "U". A rounding top may form at the end of an extended upward trend and indicates a reversal in the long-term price movement. The pattern can develop over several weeks, months or even years, and is considered a rare occurrence by many traders.

The chart below illustrates a rounding top.

NIFTY BROADNING FORMATION

A pattern that occurs during high volatility, when a security shows great movement with little direction. The formation is identified by a series of higher pivot highs and lower pivot lows. A trendline drawn over the pivot highs and under the pivot lows frames out the widening pattern. It looks like a megaphone and, in fact, it is also known by that name. 


Broadening Formation
As the two trendlines diverge from the apex, the pattern resembles a reverse version of a symmetrical triangle. This pattern is considered quite rare, but is useful in helping technicians to identify swing trades, rather than a trend trades.

PREVIOUS WEEK:
 The trade setup last week  enabled us  with two shorting opportunities during the week the first on was at the beginning of the week to sell near the pivot at 4932 level( the top made was 4910& the open and high were almost same 4906&4910) the second opportunity was a break below 4724 level , which gave near 100 points returns( the low made was 4628)


THE WEEK AHEAD:
Expected High /Low for the week 4780/4498 with 4710 being the pivot point for the week, positions taken near these levels would give good trades for the week. buying near 4510-25 levels with SAR below 4480 level and taking short positions near 4760-80 with SAR above 4800 level should be the strategy for traders with no position, the SAR traders are short from 4900 level and have part booked should also rebuild positions near the Pivot and the expected top.

Saturday, September 24, 2011

NIFTY WEEKEND ANALYSIS for the week ended 24TH SEPT 2011

Nifty started the week on a positive note and moved up-to 5168, but faced stiff resistance at  previous weeks high of 5169 and 5143 resp, on Thursday nifty faced the wrath of the bears and fell more then 4%, the biggest rally since 2008 recovery, Thanks to negative global clues, appreciation in USD against INR, high inflation, PC's name in 2G scam, FII's continued sell offs. All teaming up together to bring nifty near 52 weeks low

Let us see the alignment of some of the key technical Indicators
 Elliot Wave Count:
The complicated wave 4, as it is well known to give a false breakout before resuming the actual trend, possibly gave a false breakout in the form of Triangle posted last week, early indications of 5th impulsive down is a break of 5880, However if the lows of Friday are not breached in the early half of the week, we could see some corrective up-moves for the week in the form of sub waves of larger 5th wave.

 Ichimoku: Gave a buy signal on Last Wednesday at 5038 odd level, since the price action was well below the cloud this is considered as a week buy and still in buy mode despite the fall to sub 4900 levels the immediate resistance is likely to be at the cloud, which is currently at 5125 level.
BUZZING NIFTY: ICHIMOKU BUY


Bollinger Band: A move below the mid of BB at 4979 level  added to the strength of the bears who were able to drag nifty near the lower end of BB currently at 4796 odd level
BUZZING NIFTY: DAY BOLLINGER BAND
In the weekly chart the prices rose from the bottom of the bollinger band, but failed to test the mid BB and the big red candle on the chart is not very encouraging either, immidiate support is seen at 4742 level and   only a  close above mid of BB which is roughly at 5307 would change the midterm trend for nifty.
BUZZING NIFTY: WEEKLY BOLLINGER BAND
 
NIFTY MOVING IN A CHANNEL
From the up move to the high of 6339 to a low of 4720 nifty is moving in a channel, giving good trades, nifty after touching the lower end of the channel at 4720 level moved up , but the bears are active and pulling it back to the bottom of the channel currently near 4612 level.
   
BUZZING NIFTY: NIFTY CHANNEL IN DAY CHART
  
38 DAY EMA :  This moving average has been successively giving good trades throughout the year 2011, previous Friday nifty failed to move past this all important MA and started another round of sell off.
This time was no exception and nifty found resistance at the same MA , and the bears did not miss the trick this time around and pulled nifty far away from this important indicator.
BUZZING NIFTY: 38DEMA FAVORING BEARS

FIBONACCI RETRACEMENT LEVELS
Fibonacci retracement levels from a fall from 5740-4720 level, indicated last week, in the last week nifty moved below 23% retracement clearly indicating weakness.

BUZZING NIFTY: FIBO LEVELS

INVERTED BUMP AND RUN POSSIBLE FORMATION

BUZZING NIFTY : INVERTED BUMP AND RUN
The current setup in nifty suggest the formation of the inverted bump and run pattern , however this is very initial stage, but lets try to keep a watch on the possible formation and how the prices unfolds, a break above the current trend line would be the ray of hope for the bulls.

NIFTY LONG TERM CHART
Nifty is trading near the support as indicated in the chart, the trend line is drawn from the panic lows of 2008, a break below this trend line would be the real worry for long term investors, also the channel indicates the current down phase in the nifty, in both the cases a break above the resistance line would see nifty flying high to make newer and bigger top.
BUZZING NIFTY: NIFTY LONG TERM CHART

The week ahead: With a lot of negative news in the market, higher inflation, appreciation in USD the equity / commodity markets globally are under continued pressure, nifty is now trading below the earlier supports of 4911 and 4943 levels and will now turn into resistance, and only a move past these levels will see some short covering, as we are in the last week of the Sept contract expiry, and markets trading well below all moving averages, and Pivots, expecting more pain to the bulls
Remember the long/mid term trend of nifty is  down, but the short term is over sold and can stay like this for more time, however it can bring some sharp intraday rallies which can be used to create fresh short position for the week.

HAPPY TRADING!!!!!!!!!

Saturday, September 17, 2011

NIFTY WEEKEND ANALYSIS for the week ended 17TH SEPT 2011


Nifty started the week on a negative  note but got good support at 4900 level and moved up-to 5143.6, but failed to close above 38% retracement  of 5740-4720 and previous week high of 5169, Friday as usual saw some profit booking at higher level and nifty managed to close at 5084 , roughly 2% gain over previous week. The RBI rate hike was in line with the expectations and turned out to be a non event, however markets were volatile on Friday due to the unexpected rate hike in the prices of petrol on Thursday night and despite closing at lower levels for the day nifty managed to sustain above the previous resistance of 5040-57 range.


Let us see the alignment of some of the key technical Indicators
 Elliot Wave Count:
  
 
As indicated last week the possibility of wave 4 continuing seems to be preferred choice at the moment the chart above indicates that nifty has completed corrective b of 4 and is currently in wave c of 4th , and if a=c("a" was 4720 to 5169= 449 points, "b" was 5169to 4911=258 points, now "c" likely to be 4911+449=5360)  then nifty mighty be moving to wards the unfilled gap of 5323 level, to be followed by 5th down. Alternate wave count is not marked to avoid confusion.

 Ichimoku: Gave a buy signal on Wednesday at 5038 odd level, since the price action is below the cloud this is considered as a week buy and the immediate resistance is likely to be at the cloud, which is currently at 5296 level.


Bollinger Band: Nifty trading above mid of the bollinger band gives some hope to the  bulls and may target 5180 odd level, however a move below the mid of BB at 4979 level would surely add to the strength of the bears who would love to drag nifty to the lower end of BB currently at 4774 odd level
 In the weekly chart the prices rose from the bottom of the bollinger band, still has a mammoth task of moving past mid bollinger ban currently at 5343 which coincides with the possible EW count and unfilled GAP  levels, only a  close above 5377 would change the midterm trend for nifty.


NIFTY MOVING IN A CHANNEL
From the up move to the high of 6339 to a low of 4720 nifty is moving in a channel, giving good trades, nifty after touching the lower end of the channel at 4720 level is now moving north and would be targeting 5550 odd levels.
   
  
BULLISH 5-0 PATTERN
Bearish Shark Pattern posted last week achieved the target of 4944 level and in the process also formed a possible 5-0 bullish pattern  with targets of 5182,5351 and 5619 


38 DAY EMA :  This moving average has been successively giving good trades throughout the year 2011, previous Friday nifty failed to move past this all important MA and started another round of sell off.
This Friday was no exception and nifty found resistance at the same MA only a comfortable move past this level would add strength to the BULLS

FIBONACCI RETRACEMENT LEVELS
Fibonacci retracement levels from a fall from 5740-4720 level, indicated immediate resistance at 5110 level and the next hurdle would be to cross the 50% level at 5230 and above that is the unfilled gap Zone.


The week ahead: FII's and DII's continous buying from the lows of 4720 and  Quarterly/Half year end near the corner, MF/ INSURANCE companies also buying to keep the NAVS up will all help the bulls and also the retailers (stuck at higher levels, make an exit from the market).
 Nifty has made a range on Friday between 5075-5130, the break of the range would give early signs of the trend for the week, the weekly range of the week is 4977-5230, with 5046 being the pivot for the week
Remember the long/mid term trend of nifty is still down, only the short term trend has moved up.

HAPPY TRADING!!!!!!!!!

Saturday, April 9, 2011

NIFTY WEEKEND ANALYSIS for week ended 9th April. 2011


Nifty started the week on a positive note but failed to move past the resistance line, and ended dead  flat 5842 as compared to previous weekly close at 5654.

Let us see the alignment of some of the key technical Indicators
 
 Elliot Wave Count:
  a move past 5681 eliminated the previous wave count possibility, currently we have two possibilities
 
BUZZING NIFTY:ELLIOT WAVE COUNT
 
 1). The corrective wave from 6339 in the form of ABC correction,where B is under making, or is it completed???? and C wave down to follow. If A=C then nifty might slip to sub 5000 levels, for that the 2nd possiblity of corrective 5 wave formation, has to be invalidated.
2). Up move from 5177, with 3rd under process and wave 4 could bring nifty to 5690 odd level,if nifty gets support at 5690 and start moving up then the 1st wave count gets invalid. lets see how the price action in the coming week decides the direction of nifty, will update on this as prices unfolds .


 Ichimoku: Gave a weak buy signal on 23th March with the nifty around 5420 level  and nifty trading below the KOMU but the rise during the week not only took nifty into the cloud but managed to move wall past the upper boundary of the cloud,For the first time since the fall from Jan the price action have moved above the cloud, indicating the power of the bulls at the moment, the first sign of weakness was seen on Friday when the price action was below Tenken Sen, Nifty trading below 5845 will give some hope to the bears.


BUZZINGNIFTY:ICHIMOKU CROSS
 
BollingerBand: After trading near the top band of bollinger bears were finally able to bring a hault to the price movement , the next support would be around the mid line of the band currently @ 5646.


BUZZINGNIFTY: BOLLINGER BAND
 
 In the weekly chart the prices rose from the bottom of the bollinger band,  cleared the first resistance by moving past the mid value of the bollinger and trading above it , on its way up it could take nifty to 6100+ odd levels, the current support is around 5694 level.
BUZZINGNIFTY: WEEKLY BOLLINGER BAND


DEATH CROSS( 50DMA Crossing  below 200DMA)
The DEATH CROSS was Formed in Nifty on 4th March 2011, It is considered highly Bearish, The Last Time when we saw this formation Nifty slipped from 4800 levels to 2300 odd Levels, as the name itself indicates highest degree of Bearishness
However  nifty decided to move past 50&200 DMA,the bears will hope to do major damage as long as 200 remains below 50 sma.
Recently  there was a similar cross in S&P Index in US, but the Price movement proved otherwise,will this happen to our markets as well, currently the support of 200dma is at 5717, below which nifty gets weak.


BUZZINGNIFTY: NIFTY DEATH CROSS
BULLS/ BEAR POWER

This  indicates the power of the BULL/ BEAR as compared to the price action.
As can be seen in the Chart that the bears power increased during the week, whereas the bull-power indicator has not been showing weakness in the strength. A fall from 5944 level in the past week indicate that the bulls are loosing the momentum at the moment.
 
BUZZINGNIFTY: BULL/BEAR POWER
 
  
  GARTLEY BEARISH:  BAT


Nifty got resisted at 5943, just short of its target of 5965, the detailed analysis of this pattern, and possible targets can be found in previous post
BUZZINGNIFTY:GARTLEY BEARISH BAT


PINHEAD REVERSAL IN WEEKLY CHART

The weekly open and close at 5842 and a long tail formed a pinhead which is a reversal pattern if formed at the top,the confirmation of the same would only be possible if nifty continue to trade below the weekly close.


BUZZINGNIFTY : PINHEAD REVERSAL


RESISTANCE AND SUPPORT;As can be seen in the chart the support is at 5791, the line shows nifty got resisted at it several times, now this should act as support, for nifty to continue its journey north, the resistance is near 5906 level for the week


BUZZINGNIFTY: SUPPORT LINE


For the week support is seen near 5691 level and resistance near 5906, risk reward ratio for the positions taken near these levels would be high near these levels, a break of this range will give clear direction to nifty .

Saturday, April 2, 2011

NIFTY WEEKEND ANALYSIS for week ended 1st April. 2011

Nifty started the week on a positive note and continued to rise through out the week before giving a flat close on Friday and closed at 5826 as compared to previous weekly close at 5654. A good gain of nearly 170 points for the week, The April contract started on a negative note, with immediate resistance at previous days high of 5873, unless that is crossed the bears have some hope for this expiry.

Let us see the alignment of some of the key technical Indicators
 
 Elliot Wave Count:
Although i am not very good at EW readings but this is how i see them at the moment, a move past 5681 eliminated the previous wave count possibility, currently we have two possibilities
 
BUZZING NIFTY:ELLIOT WAVE COUNT
 
 1). The corrective wave from 6339 in the form of ABC correction,where B is under making, or is it completed???? and C wave down to follow. If A=C then nifty might slip to sub 5000 levels, for that the 2nd possiblity of corrective 5 wave formation, has to be invalidated.
2). Up move from 5177, with 3rd under process and wave 4 could bring nifty to 5690 odd level,if nifty gets support at 5690 and start moving up then the 1st wave count gets invalid. lets see how the price action in the coming week decides the direction of nifty, will update on this as prices unfolds .


 Ichimoku: Gave a weak buy signal on 23th March with the nifty around 5420 level  and nifty trading below the KOMU but the rise during the week not only took nifty into the cloud but managed to move wall past the upper boundary of the cloud,For the first time since the fall from Jan the price action have moved above the cloud, indicating the power of the bulls at the moment, the first sign of weakness would be seen once nifty starts trading in the cloud roughly at 5715 level.

BUZZING NIFTY:ICHIMOKU PRICE ABOVE CLOUD


BollingerBand: As indicated last week despite trading above the upper range of the bollinger band nifty continued to do the same throughout the week, the opening on Monday and price action for the first two days of the week will help to analyze the coming moment in nifty

BUZZING NIFTY: BOLLINGER BAND
 In the weekly chart the prices rose from the bottom of the bollinger band,  cleared the first resistance by moving past the mid value of the bollinger and trading above it , on its way up it could take nifty to 6100+ odd levels, the current support is around 5707 level.

BUZZING NIFTY: WEEKLY BOLLINGER BAND


DEATH CROSS( 50DMA Crossing  below 200DMA)
The DEATH CROSS was Formed in Nifty on 4th March 2011, It is considered highly Bearish, The Last Time when we saw this formation Nifty slipped from 4800 levels to 2300 odd Levels, as the name itself indicates highest degree of Bearishness
However  nifty decided to move past 50&200 DMA,
Recently  there was a similar cross in S&P Index in US, but the Price movement proved otherwise,will this happen to our markets as well, currently the support of 200dma is at 5704, below which nifty gets weak.
BUZZING NIFTY: DEATH CROSS


BULLS/ BEAR POWER

This is one indicator which i,ve recently added to the study, this simply indicates the power of the BULL/ BEAR as compared to the price action.
As can be seen in the Chart that the bears power has been reducing, whereas the bull-power indicator has seen a sudden rise and given a breakout from the range, indicating the bulls are not only gaining the control over bears but also able to move the prices above the range. A fall from 5873 level in the last two days indicate that the bulls are loosing the momentum at the moment  whereas there is no increase in bear power, indicated that the bears are not confident at the moment.

BUZZING NIFTY:BULL/BEAR POWER


  BEARISH FLAG
In one of the previous post we saw a triangle formation and a bearish flag in Nifty, although the triangle  as well as the flag has given a breakout, but will have to keep an eye on the false breakout, before reassumption of the actual trend


GARTLEY BEARISH: ALTERNATE BAT


Nifty got resisted at the lower boundary of the bat formation after touching 5873 nifty fell sharply, however the time target for the formation is till 6th April, since this is a bearish pattern nifty would slip to previous low around 5233.

BUZZING NIFTY: ALTERNATE BAT


NARROW RANGE 7


If a price bar's range is less than the previous 6 bars' ranges (measured independently) it is said to have the narrowest range in 7 days or NR7, its implies  reversal of the trend or loosing of the momentum.

BUZZING NIFTY: NR7


RESISTANCE;As can be seen in the chart there are multiple resistances near 5935-65 range, a move past these resistances will see nifty continuing the journey north.

BUZZING NIFTY: RESISTANCE LINE


For the week support is seen near 5700 level and resistance near 5965, risk reward ratio for the positions taken near these levels would be high near these levels.


Popular Posts

NIFTY STOP AND REVERSE TRADING STRATEGY

NIFTY SAR(STOP AND REVERSE) FOR THE NEXT DAY IS POSTED ON DAILY BASIS ON FACEBOOK GROUP NIFTYHOLIC.

ALL VALUES ARE FOR SPOT NIFTY, TRADE THE FUTURES ACCORDINGLY

SAMPLE SAR

NIFTY SAR FOR 23RD MARCH 2011

SAR FOR 23RD MARCH,

SELL NIFTY BELOW 5405 AND GO LONG ABOVE 5430

IF HOLDS ON CLOSING BASIS

...

LAST TRADE

PART BOOKED @5385=120 POINTS OR 6000 RS.

CLOSED THE POSITION ON 22ND MARCH @5405=100 POINTS OR 5000 RS.

TOTAL PROFIT IN LAST TRADE WITH 2 LOTS=11000/-

AS ON 22ND MARCH

NIFTY RANGE FOR THE MARCH SERIES 5214.38 -- 5613.32

PCR INDEX OPTIONS-- 1.13(BEARISH)

INDIA VIX --22.26

SMR(smart Money Ratio)=16.73053(Bearish)


DISCLAIMER

Any action you choose to take in the markets is totally your own responsibility. Buzzingnifty™ will not be liable for any, direct or indirect, consequential or incidental damages or loss arising out of the use of this information. The services are based on technical analysis. They are neither an offer to sell nor solicitation to buy any of the securities mentioned herein. The writers may or may not be trading in the securities mentioned.