Ads 468x60px

Showing posts with label GARTLEY. Show all posts

Monday, January 7, 2013

BEARISH BAT IN HDIL HOURLY CHART


BUZZING NIFTY : BEARISH BAT FORMATION IN HDIL


A bearish formation in HDIL stock, a lot of such patterns are developing in INDEX & STOCKS, which would be updated as and when they complete the formation along with the projected targets.
Happy Trading!!!!!

Thursday, December 15, 2011

NIFTY BULLISH FALLING WEDGE IN HOUR CHART/ POSITIVE DIVERGENCE

Nifty bullish falling wedge formation in hourly charts, the support comes near 4650 odd levels, a break above 4774 would confirm short term reversal on the index, might target 5090-5100 odd level.
Price behavior in nifty suggest another bullish possibility in the form of positive divergence in both MACD and 9RSI, if nifty manages to hold on to the support line indicated in the above chart, these divergence would ensure a good run for the bulls at-least in short term.

Nifty is holding the current lows also favors the possiblity of Gartley pattern in day chart posted earlier
refer link.
http://buzzingnifty.blogspot.com/2011/12/nifty-trade-setup-for-week-12-17dec.html

Monday, December 12, 2011

NIFTY TRADE SETUP FOR THE WEEK 12-17DEC 2011

Nifty continues to trade in the range, after quick recovery from the low of 4639 the index is slowly moving towards the bottom.
A bearish Gartley is in the making and if nifty finds support between 4680-4720 levels the we would be moving north to complete the pattern.

TRADE SETUP FOR THE WEEK: Expected high /low for the week 4982/4724, with pivot at 4932, positions taken near these levels would yield good returns, SAR traders are short near the pivot since last Friday and already part booked at 50& 100 points respectively

Saturday, September 17, 2011

NIFTY WEEKEND ANALYSIS for the week ended 17TH SEPT 2011


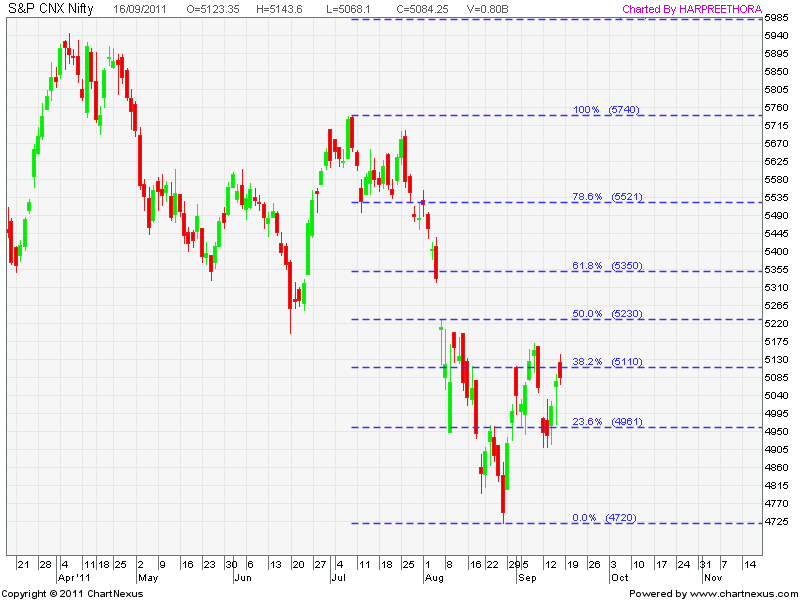
Nifty started the week on a negative  note but got good support at 4900 level and moved up-to 5143.6, but failed to close above 38% retracement  of 5740-4720 and previous week high of 5169, Friday as usual saw some profit booking at higher level and nifty managed to close at 5084 , roughly 2% gain over previous week. The RBI rate hike was in line with the expectations and turned out to be a non event, however markets were volatile on Friday due to the unexpected rate hike in the prices of petrol on Thursday night and despite closing at lower levels for the day nifty managed to sustain above the previous resistance of 5040-57 range.


Let us see the alignment of some of the key technical Indicators
 Elliot Wave Count:
  
 
As indicated last week the possibility of wave 4 continuing seems to be preferred choice at the moment the chart above indicates that nifty has completed corrective b of 4 and is currently in wave c of 4th , and if a=c("a" was 4720 to 5169= 449 points, "b" was 5169to 4911=258 points, now "c" likely to be 4911+449=5360)  then nifty mighty be moving to wards the unfilled gap of 5323 level, to be followed by 5th down. Alternate wave count is not marked to avoid confusion.

 Ichimoku: Gave a buy signal on Wednesday at 5038 odd level, since the price action is below the cloud this is considered as a week buy and the immediate resistance is likely to be at the cloud, which is currently at 5296 level.


Bollinger Band: Nifty trading above mid of the bollinger band gives some hope to the  bulls and may target 5180 odd level, however a move below the mid of BB at 4979 level would surely add to the strength of the bears who would love to drag nifty to the lower end of BB currently at 4774 odd level
 In the weekly chart the prices rose from the bottom of the bollinger band, still has a mammoth task of moving past mid bollinger ban currently at 5343 which coincides with the possible EW count and unfilled GAP  levels, only a  close above 5377 would change the midterm trend for nifty.


NIFTY MOVING IN A CHANNEL
From the up move to the high of 6339 to a low of 4720 nifty is moving in a channel, giving good trades, nifty after touching the lower end of the channel at 4720 level is now moving north and would be targeting 5550 odd levels.
   
  
BULLISH 5-0 PATTERN
Bearish Shark Pattern posted last week achieved the target of 4944 level and in the process also formed a possible 5-0 bullish pattern  with targets of 5182,5351 and 5619 


38 DAY EMA :  This moving average has been successively giving good trades throughout the year 2011, previous Friday nifty failed to move past this all important MA and started another round of sell off.
This Friday was no exception and nifty found resistance at the same MA only a comfortable move past this level would add strength to the BULLS

FIBONACCI RETRACEMENT LEVELS
Fibonacci retracement levels from a fall from 5740-4720 level, indicated immediate resistance at 5110 level and the next hurdle would be to cross the 50% level at 5230 and above that is the unfilled gap Zone.


The week ahead: FII's and DII's continous buying from the lows of 4720 and  Quarterly/Half year end near the corner, MF/ INSURANCE companies also buying to keep the NAVS up will all help the bulls and also the retailers (stuck at higher levels, make an exit from the market).
 Nifty has made a range on Friday between 5075-5130, the break of the range would give early signs of the trend for the week, the weekly range of the week is 4977-5230, with 5046 being the pivot for the week
Remember the long/mid term trend of nifty is still down, only the short term trend has moved up.

HAPPY TRADING!!!!!!!!!

Saturday, September 10, 2011

NIFTY WEEKEND ANALYSIS for the week ended 9TH SEPT 2011


Nifty started the week on a positive note and moved up-to 5169, but failed to close above 38% retracement  of 5740-4720 and ended  flat 5059 as compared to previous weekly close at 5040. indicating the up move corrective in nature, and should resume the down trend

Let us see the alignment of some of the key technical Indicators
 Elliot Wave Count:
  
 The corrective wave 4th  up could have ended at 5169 and the 5th impulsive down might have started, a confirmation of the same would be nifty moving below 4880 level


 Ichimoku: Already in sell for a good time now gave another bearish signal of friday , as nifty falied to close above the Tanken Sen line, indicating continued weakness despite a good 450 odd points rally from the bottom.
BUZZING NIFTY: ICHIMOKU


Bollinger Band: Nifty trading above mid of the bollinger band gives some hope to the ailing bulls and may target 5220 odd level, however a move below the mid of BB at 4999 would surely add to the strength of the bears who would love to drag nifty to the lower end of BB currently at 4774 odd level


BUZZINGNIFTY: BOLLINGER BAND
 In the weekly chart the prices rose from the bottom of the bollinger band, still has a mammoth task of moving past 5377 which looks like a distinct possibility also there is a unfilled gap between 5220-5350, only a  close above 5377 would change the midterm trend for nifty.
BUZZINGNIFTY: WEEKLY BOLLINGER BAND


NIFTY MOVING IN A CHANNEL
From the up move to the high of 6339 to a low of 4720 nifty is moving in a channel, giving good trades
   
BUZZINGNIFTY: NIFTY CHANNEL
  
 BEARISH: SHARK PATTERN

Nifty got resisted at 5169, just short of its target of 5189, the detailed analysis of this pattern, and possible targets can be found in the chart below


BUZZINGNIFTY: BEARISH SHARK PATTERN


38 DAY EMA :  This moving average has been successively giving good trades throughout the year 2011, on Friday also nifty failed to move past this all important MA and started another round of sell off.
NIFTY 38DEMA

The week ahead: RBI meet on rate hikes expected next weekend (on 17th Sept)  so the banking stocks would be under pressure and may give huge intraday moves, Expected Range for the week 5000 to 5227, however a move past these levels would give excellent trades in the direction of the move. Remember the larger trend is down and daily too has turned down

HAPPY TRADING!!!!!!!!!

Saturday, May 7, 2011

NIFTY WEEKEND ANALYSIS for week ended 6th May. 2011

Nifty started the week on a very negative note and continued to fall through out the week before giving a dead cat bounce or short covering on Friday close on Friday and closed at 5551 as compared to previous weekly close at 5751. A good fall of nearly 200 points for the week, The May contract started on a negative note, and open interest data showing huge short building in Nifty


Let us see the alignment of some of the key technical Indicators
 
 Ichimoku: Gave a weak sell signal on 28th April with the nifty around 5797 level  and nifty entered the   the KOMU but the rise on friday saw nifty moving above cloud thus weakning the selling pressure, fail to cross 5600 by Thursday and nifty will become weak as price would be in the cloud again.
BUZZING NIFTY : ICHIMOKU WEAK SELL SIGNAL

BollingerBand: For 3 days in a row nifty closed below the lower bollinger band , the rise was expected but that was more of a profit booking, and sudden dip in Crude Prices, nifty can rise from here to test the Mid level of the Band around 5769 level
BUZZING NIFTY : BOLLINGER BAND

 In the weekly chart the Nifty is trading below the Mid level of the band currently around 5669, fail to clear this during the week and nifty may continue the journey south to test the lower level of the band which is currently around 5200 odd level.
BUZZING NIFTY : BOLLINGER BAND


In the month chart however the story seems different, as nifty took the support of the mid band of the level at 5445, nifty is yet to give a monthly close below the mid-level of the band for long, a close below 5445 would be yet another indication of the nifty entering the bearish zone,
 

  GARTLEY BEARISH: ALTERNATE BAT

As discussed on several occasions in the past, nifty started moving down and already achieved 4th target,
From earlier update::
Nifty got resisted at the lower boundary of the bat formation after touching 5873 nifty fell sharply, however the time target for the formation is till 6th April, since this is a bearish pattern nifty would slip to previous low around 5233.


BUZZING NIFTY: ALTERNATE BAT


BULLISH GARTLEY: BAT/CRAB PATTERN: 
If this is a BAT formation then this might have completed the CD leg and now the up-move should follow, but if this is a CRAB in formation then the last Leg CD would complete between 5243-4997, however this is not a perfect formation as the above bearish pattern.


TRIANGLE FORMATION IN WEEKLY CHART;As can be seen in the chart the Nifty broke the lower line of the triangle but managed to close inside the triangle, if this was a false breakdown then nifty should start moving up to test the upper boundary of the triangle roughly near 5870 level, but a fall below 5229 during the week would be highly desired by the Bears camp who have a huge short built up since the start of the month.


For the week support is seen near 5500 level and resistance near 5600, risk reward ratio for the positions taken near these levels would be high near these levels. Since the trend is down any long position created should be properly hedged. As per the open interest setup looks loke a good support near 5400 level and resistance at 5600 level.
Expected high for the week 5663- Expected low for the week is 5331

Saturday, April 9, 2011

NIFTY WEEKEND ANALYSIS for week ended 9th April. 2011


Nifty started the week on a positive note but failed to move past the resistance line, and ended dead  flat 5842 as compared to previous weekly close at 5654.

Let us see the alignment of some of the key technical Indicators
 
 Elliot Wave Count:
  a move past 5681 eliminated the previous wave count possibility, currently we have two possibilities
 
BUZZING NIFTY:ELLIOT WAVE COUNT
 
 1). The corrective wave from 6339 in the form of ABC correction,where B is under making, or is it completed???? and C wave down to follow. If A=C then nifty might slip to sub 5000 levels, for that the 2nd possiblity of corrective 5 wave formation, has to be invalidated.
2). Up move from 5177, with 3rd under process and wave 4 could bring nifty to 5690 odd level,if nifty gets support at 5690 and start moving up then the 1st wave count gets invalid. lets see how the price action in the coming week decides the direction of nifty, will update on this as prices unfolds .


 Ichimoku: Gave a weak buy signal on 23th March with the nifty around 5420 level  and nifty trading below the KOMU but the rise during the week not only took nifty into the cloud but managed to move wall past the upper boundary of the cloud,For the first time since the fall from Jan the price action have moved above the cloud, indicating the power of the bulls at the moment, the first sign of weakness was seen on Friday when the price action was below Tenken Sen, Nifty trading below 5845 will give some hope to the bears.


BUZZINGNIFTY:ICHIMOKU CROSS
 
BollingerBand: After trading near the top band of bollinger bears were finally able to bring a hault to the price movement , the next support would be around the mid line of the band currently @ 5646.


BUZZINGNIFTY: BOLLINGER BAND
 
 In the weekly chart the prices rose from the bottom of the bollinger band,  cleared the first resistance by moving past the mid value of the bollinger and trading above it , on its way up it could take nifty to 6100+ odd levels, the current support is around 5694 level.
BUZZINGNIFTY: WEEKLY BOLLINGER BAND


DEATH CROSS( 50DMA Crossing  below 200DMA)
The DEATH CROSS was Formed in Nifty on 4th March 2011, It is considered highly Bearish, The Last Time when we saw this formation Nifty slipped from 4800 levels to 2300 odd Levels, as the name itself indicates highest degree of Bearishness
However  nifty decided to move past 50&200 DMA,the bears will hope to do major damage as long as 200 remains below 50 sma.
Recently  there was a similar cross in S&P Index in US, but the Price movement proved otherwise,will this happen to our markets as well, currently the support of 200dma is at 5717, below which nifty gets weak.


BUZZINGNIFTY: NIFTY DEATH CROSS
BULLS/ BEAR POWER

This  indicates the power of the BULL/ BEAR as compared to the price action.
As can be seen in the Chart that the bears power increased during the week, whereas the bull-power indicator has not been showing weakness in the strength. A fall from 5944 level in the past week indicate that the bulls are loosing the momentum at the moment.
 
BUZZINGNIFTY: BULL/BEAR POWER
 
  
  GARTLEY BEARISH:  BAT


Nifty got resisted at 5943, just short of its target of 5965, the detailed analysis of this pattern, and possible targets can be found in previous post
BUZZINGNIFTY:GARTLEY BEARISH BAT


PINHEAD REVERSAL IN WEEKLY CHART

The weekly open and close at 5842 and a long tail formed a pinhead which is a reversal pattern if formed at the top,the confirmation of the same would only be possible if nifty continue to trade below the weekly close.


BUZZINGNIFTY : PINHEAD REVERSAL


RESISTANCE AND SUPPORT;As can be seen in the chart the support is at 5791, the line shows nifty got resisted at it several times, now this should act as support, for nifty to continue its journey north, the resistance is near 5906 level for the week


BUZZINGNIFTY: SUPPORT LINE


For the week support is seen near 5691 level and resistance near 5906, risk reward ratio for the positions taken near these levels would be high near these levels, a break of this range will give clear direction to nifty .

Thursday, April 7, 2011

NIFTY CONTINUATION OF PATTERN- POSSIBLE TARGET

BUZZING NIFTY : GARTLEY(BAT) PATTERN

As of now it looks like the (BAT with target of 5965 ) gartley pattern is over, as can be seen as the Wednesdays candle formed the top,
Gartley  based on Fibonacci Retracement and Extention has targets based on retracement of the CD leg of the formation.
TIME TARGET: The previous patterns took almost twice the time taken by CD leg of the formation, for this pattern to yield desired results the time horizon would be 57-76 days
PRICE TARGET: Technical Target of these pattern varies, Ideal point to book profit is between 61.8%-78.6%, but in the past instances the prices have retraced more then 161.8% of the CD Leg.    Possible Targets of Pattern
  1. 23.6%---5776.49
  2. 38.2%---5672.58
  3. 50%-----5588.60
  4. 61.8%---5504.62
  5. 78.6%---5385.05
  6. 88.7%---5313.17
  7. 100%----5232.75
  8. 114.6%--5128.84
  9. 123.6%--5064.79
  10.  127.2%-5039.17
  11. 138.2%--4960.9
  12. 150%----4876.9
  13.  161.8%-4792

 
  CONTD FROM LAST POST........

AS INDICATED ON MONDAY,THIS PATTERN IS LIKELY TO BE COMPLETED ON WEDNESDAY OR THURSDAY, BE CAUTIOUS WITH ALL THE LONGS, AND PLACE PROPER STOP LOSS IN ALL THE POSITIONS.

 CONTD FROM LAST POST........
The first post regarding continuation of patterns in Nifty first posted on 16th Feb 2011, at that time AB up was under formation.
Subsequent post on 26th Feb indicated BC was near over and larger CD could start.
As the price action in the last week indicates making of CD leg of the formation, will have to watch if the move really is on the way up to complete the formation.
Below is the detailed analysis of the earlier formations and the possible targets for the current formation


Down Trend 1( Start of continuation Patterns)
BAT PATTERN(BEARISH)
fall 6284 to 5966 = 318 points in 5 days
rise 5966 to 6151= 186 points or 58.5% in 3 days
fall 6151 to 5937= 214 points or 115% in 4 days
rise 5937 to 6338= 410 points or 195%in 5 days
PATTERN COMPLETED
resulting in a bigger fall to 5690 in 15 days

Down Trend 2(Larger Pattern)
GARTLEY( BEARISH)

fall 6338 to 5690 = 648 points in 15days

rise 5690 to 6069= 379 points or 58.5% in 6 days

fall 6069 to 5721=348 points or 90% in 5 days

rise 5721 to 6181= 460 points or 135%in 16 days
PATTERN COMPLETED 
 resulting in a bigger fall to 5177 in 15 days

Down Trend 3(Largest in the making)
POSSIBLE FORMATION

BAT / ALTERNATE BAT/ CRAB PATTERN(ALL BEARISH)
fall 6181 to 5177  = 1004 points in 37 days

rise 5177 to 5599= 422 points in 7 days

fall 5599 to 5232= 367 points in 7 days


IF THE NIFTY GETS SUPPORT FROM HERE THEN POSSIBLE TARGETS

BAT PATTERN


a).rise 5232 to 5965= 733 points in 35-40 days
b)..rise 5232 to 6310= 1078 points in 35-40 days


ALTERNATE BAT PATTERN


a).rise 5232 to 6065= 833 points in 35-40 days
b)..rise 5232 to 6191= 959 points in 35-40 days


CRAB PATTERN


a).rise 5232 to 6383= 1151 points in 35-40 days
b)..rise 5232 to 6799= 1567 points in 35-40 days


In reference to the post read:
BUZZING NIFTY: FOLLOWUP POST 3 NIFTY CONTINUATION OF PATTERNS
BUZZING NIFTY: NIFTY CONTINUATION OF PATTERNS--FOLLOWUP POST 2
BUZZING NIFTY: FOLLOWUP POST NIFTY CONTINUATION OF PATTERNS
BUZZING NIFTY: NIFTY CONTINUATION OF PATTERNS

Monday, April 4, 2011

FOLLOWUP POST 3 NIFTY CONTINUATION OF PATTERNS

BUZZINGNIFTY: GARTLEY NEAR COMPLETION


THIS PATTERN IS LIKELY TO BE COMPLETED ON WEDNESDAY OR THURSDAY, BE CAUTIOUS WITH ALL THE LONGS, AND PLACE PROPER STOP LOSS IN ALL THE POSITIONS.


 CONTD FROM LAST POST........
The first post regarding continuation of patterns in Nifty first posted on 16th Feb 2011, at that time AB up was under formation.
Subsequent post on 26th Feb indicated BC was near over and larger CD could start.
As the price action in the last week indicates making of CD leg of the formation, will have to watch if the move really is on the way up to complete the formation.
Below is the detailed analysis of the earlier formations and the possible targets for the current formation


Down Trend 1( Start of continuation Patterns)
BAT PATTERN(BEARISH)
fall 6284 to 5966 = 318 points in 5 days
rise 5966 to 6151= 186 points or 58.5% in 3 days
fall 6151 to 5937= 214 points or 115% in 4 days
rise 5937 to 6338= 410 points or 195%in 5 days
PATTERN COMPLETED
resulting in a bigger fall to 5690 in 15 days

Down Trend 2(Larger Pattern)
GARTLEY( BEARISH)

fall 6338 to 5690 = 648 points in 15days

rise 5690 to 6069= 379 points or 58.5% in 6 days

fall 6069 to 5721=348 points or 90% in 5 days

rise 5721 to 6181= 460 points or 135%in 16 days
PATTERN COMPLETED 
 resulting in a bigger fall to 5177 in 15 days

Down Trend 3(Largest in the making)
POSSIBLE FORMATION

BAT / ALTERNATE BAT/ CRAB PATTERN(ALL BEARISH)
fall 6181 to 5177  = 1004 points in 37 days

rise 5177 to 5599= 422 points in 7 days

fall 5599 to 5232= 367 points in 7 days


IF THE NIFTY GETS SUPPORT FROM HERE THEN POSSIBLE TARGETS

BAT PATTERN


a).rise 5232 to 5965= 733 points in 35-40 days
b)..rise 5232 to 6310= 1078 points in 35-40 days


ALTERNATE BAT PATTERN


a).rise 5232 to 6065= 833 points in 35-40 days
b)..rise 5232 to 6191= 959 points in 35-40 days


CRAB PATTERN


a).rise 5232 to 6383= 1151 points in 35-40 days
b)..rise 5232 to 6799= 1567 points in 35-40 days


Will update the targets after the confirmation of completion of the Pattern


In reference to the post read:
BUZZING NIFTY: NIFTY CONTINUATION OF PATTERNS--FOLLOWUP POST 2
BUZZING NIFTY: FOLLOWUP POST NIFTY CONTINUATION OF PATTERNS
BUZZING NIFTY: NIFTY CONTINUATION OF PATTERNS

Saturday, April 2, 2011

NIFTY WEEKEND ANALYSIS for week ended 1st April. 2011

Nifty started the week on a positive note and continued to rise through out the week before giving a flat close on Friday and closed at 5826 as compared to previous weekly close at 5654. A good gain of nearly 170 points for the week, The April contract started on a negative note, with immediate resistance at previous days high of 5873, unless that is crossed the bears have some hope for this expiry.

Let us see the alignment of some of the key technical Indicators
 
 Elliot Wave Count:
Although i am not very good at EW readings but this is how i see them at the moment, a move past 5681 eliminated the previous wave count possibility, currently we have two possibilities
 
BUZZING NIFTY:ELLIOT WAVE COUNT
 
 1). The corrective wave from 6339 in the form of ABC correction,where B is under making, or is it completed???? and C wave down to follow. If A=C then nifty might slip to sub 5000 levels, for that the 2nd possiblity of corrective 5 wave formation, has to be invalidated.
2). Up move from 5177, with 3rd under process and wave 4 could bring nifty to 5690 odd level,if nifty gets support at 5690 and start moving up then the 1st wave count gets invalid. lets see how the price action in the coming week decides the direction of nifty, will update on this as prices unfolds .


 Ichimoku: Gave a weak buy signal on 23th March with the nifty around 5420 level  and nifty trading below the KOMU but the rise during the week not only took nifty into the cloud but managed to move wall past the upper boundary of the cloud,For the first time since the fall from Jan the price action have moved above the cloud, indicating the power of the bulls at the moment, the first sign of weakness would be seen once nifty starts trading in the cloud roughly at 5715 level.

BUZZING NIFTY:ICHIMOKU PRICE ABOVE CLOUD


BollingerBand: As indicated last week despite trading above the upper range of the bollinger band nifty continued to do the same throughout the week, the opening on Monday and price action for the first two days of the week will help to analyze the coming moment in nifty

BUZZING NIFTY: BOLLINGER BAND
 In the weekly chart the prices rose from the bottom of the bollinger band,  cleared the first resistance by moving past the mid value of the bollinger and trading above it , on its way up it could take nifty to 6100+ odd levels, the current support is around 5707 level.

BUZZING NIFTY: WEEKLY BOLLINGER BAND


DEATH CROSS( 50DMA Crossing  below 200DMA)
The DEATH CROSS was Formed in Nifty on 4th March 2011, It is considered highly Bearish, The Last Time when we saw this formation Nifty slipped from 4800 levels to 2300 odd Levels, as the name itself indicates highest degree of Bearishness
However  nifty decided to move past 50&200 DMA,
Recently  there was a similar cross in S&P Index in US, but the Price movement proved otherwise,will this happen to our markets as well, currently the support of 200dma is at 5704, below which nifty gets weak.
BUZZING NIFTY: DEATH CROSS


BULLS/ BEAR POWER

This is one indicator which i,ve recently added to the study, this simply indicates the power of the BULL/ BEAR as compared to the price action.
As can be seen in the Chart that the bears power has been reducing, whereas the bull-power indicator has seen a sudden rise and given a breakout from the range, indicating the bulls are not only gaining the control over bears but also able to move the prices above the range. A fall from 5873 level in the last two days indicate that the bulls are loosing the momentum at the moment  whereas there is no increase in bear power, indicated that the bears are not confident at the moment.

BUZZING NIFTY:BULL/BEAR POWER


  BEARISH FLAG
In one of the previous post we saw a triangle formation and a bearish flag in Nifty, although the triangle  as well as the flag has given a breakout, but will have to keep an eye on the false breakout, before reassumption of the actual trend


GARTLEY BEARISH: ALTERNATE BAT


Nifty got resisted at the lower boundary of the bat formation after touching 5873 nifty fell sharply, however the time target for the formation is till 6th April, since this is a bearish pattern nifty would slip to previous low around 5233.

BUZZING NIFTY: ALTERNATE BAT


NARROW RANGE 7


If a price bar's range is less than the previous 6 bars' ranges (measured independently) it is said to have the narrowest range in 7 days or NR7, its implies  reversal of the trend or loosing of the momentum.

BUZZING NIFTY: NR7


RESISTANCE;As can be seen in the chart there are multiple resistances near 5935-65 range, a move past these resistances will see nifty continuing the journey north.

BUZZING NIFTY: RESISTANCE LINE


For the week support is seen near 5700 level and resistance near 5965, risk reward ratio for the positions taken near these levels would be high near these levels.


Wednesday, March 30, 2011

NIFTY FIBONACCI RESISTANCE

Nifty has retraced 68.2% @5797, of the fall from 6181 to 5177.A close above 5797 will only add more strength to the bull, with expiry day arriving, current upmove should not end without adding more pains to the bears camp.
FIBONACCI RETRACEMENT AND CHANNEL TOP


NIFTY GARTLEY
In the second chart is shown the prices taking a pause at the bottom of the price range of the Gartley pattern.A good news for the bears is that the pattern will be completed on Wednesday but not before taking every single bear out of trade.


Saturday, March 26, 2011

NIFTY CONTINUATION OF PATTERNS--FOLLOWUP POST 2

NIFTY CONTINUATION OF PATTERNS

 The first post regarding continuation of patterns in Nifty first posted on 16th Feb 2011, at that time AB up was under formation.
Subsequent post on 26th Feb indicated BC was near over and larger CD could start.
As the price action in the last week indicates making of CD leg of the formation, will have to watch if the move really is on the way up to complete the formation.
Below is the detailed analysis of the earlier formations and the possible targets for the current formation


Down Trend 1( Start of continuation Patterns)
BAT PATTERN(BEARISH)
fall 6284 to 5966 = 318 points in 5 days
rise 5966 to 6151= 186 points or 58.5% in 3 days
fall 6151 to 5937= 214 points or 115% in 4 days
rise 5937 to 6338= 410 points or 195%in 5 days
PATTERN COMPLETED
resulting in a bigger fall to 5690 in 15 days

Down Trend 2(Larger Pattern)
GARTLEY( BEARISH)

fall 6338 to 5690 = 648 points in 15days

rise 5690 to 6069= 379 points or 58.5% in 6 days

fall 6069 to 5721=348 points or 90% in 5 days

rise 5721 to 6181= 460 points or 135%in 16 days
PATTERN COMPLETED 
 resulting in a bigger fall to 5177 in 15 days

Down Trend 3(Largest in the making)
POSSIBLE FORMATION

BAT / ALTERNATE BAT/ CRAB PATTERN(ALL BEARISH)
fall 6181 to 5177  = 1004 points in 37 days

rise 5177 to 5599= 422 points in 7 days

fall 5599 to 5232= 367 points in 7 days


IF THE NIFTY GETS SUPPORT FROM HERE THEN POSSIBLE TARGETS

BAT PATTERN


a).rise 5232 to 5965= 733 points in 35-40 days
b)..rise 5232 to 6310= 1078 points in 35-40 days


ALTERNATE BAT PATTERN


a).rise 5232 to 6065= 833 points in 35-40 days
b)..rise 5232 to 6191= 959 points in 35-40 days


CRAB PATTERN


a).rise 5232 to 6383= 1151 points in 35-40 days
b)..rise 5232 to 6799= 1567 points in 35-40 days


In reference to the post read:
BUZZING NIFTY: FOLLOWUP POST NIFTY CONTINUATION OF PATTERNS
BUZZING NIFTY: NIFTY CONTINUATION OF PATTERNS

Saturday, February 26, 2011

FOLLOWUP POST NIFTY CONTINUATION OF PATTERNS

AS INDICATED EARLIER, NIFTY SEEMS TO BE REALLY MOVING IN CONTINUATION ,
JUST HAVE A LOOK AT THE CHART,


Details based on the above observations

Down Trend 1( Start of continuation Patterns)
BAT PATTERN(BEARISH)
fall 6284 to 5966 = 318 points in 5 days
rise 5966 to 6151= 186 points or 58.5% in 3 days
fall 6151 to 5937= 214 points or 115% in 4 days
rise 5937 to 6338= 410 points or 195%in 5 days
PATTERN COMPLETED
resulting in a bigger fall to 5690 in 15 days

Down Trend 2(Larger Pattern)
GARTLEY( BEARISH)

fall 6338 to 5690 = 648 points in 15days

rise 5690 to 6069= 379 points or 58.5% in 6 days

fall 6069 to 5721=348 points or 90% in 5 days

rise 5721 to 6181= 460 points or 135%in 16 days
PATTERN COMPLETED 
 resulting in a bigger fall to 5177 in 15 days

Down Trend 3(Largest in the making)
POSSIBLE FORMATION

BAT / ALTERNATE BAT/ CRAB PATTERN(ALL BEARISH)
fall 6181 to 5177  = 1004 points in 37 days

rise 5177 to 5599= 422 points in 7 days

fall 5599 to 5232= 367 points in 7 days


IF THE NIFTY GETS SUPPORT FROM HERE THEN POSSIBLE TARGETS

BAT PATTERN


a).rise 5232 to 5965= 733 points in 35-40 days
b)..rise 5232 to 6310= 1078 points in 35-40 days


ALTERNATE BAT PATTERN


a).rise 5232 to 6065= 833 points in 35-40 days
b)..rise 5232 to 6191= 959 points in 35-40 days


CRAB PATTERN


a).rise 5232 to 6383= 1151 points in 35-40 days
b)..rise 5232 to 6799= 1567 points in 35-40 days

 the first look at the possible out come of the possible target will make one laugh at the analysis,
Considering the fact that these all are bearish patterns, and the time frame to complete.

 DO REMEMBER

 DIWALI historically has been a bad day for the markets, this time market made a new all time high on this day.
Dec 2010 every TV channel, all analyst were saying markets to touch newer highs next month, markets reacted opposite and fall to 5177.
Inverse co-relation with the developed markets, as already stated in the last post, when US markets were under pressure we were busy making newer highs, when their markets gained confidence and started moving north our markets saw steeper falls. US and European Markets are trading at Highs and they will start to correct sooner or later, will we follow them in the falls????????????
Bank Nifty which has been the leader or the direction decider for the Nifty, didn't test the lows of Thursday, and closed near to 10400 which is an important support level.
The prices at the moment are well below all traced moving averages. FII's are on a selling spree, jhunjunwala selling stake, does this indicate bearishness in the markets.????????

Simple trading strategy is to go long above 5200 with 5177(previous low)as the stop-loss , start accumulating blue chip stocks,
If previous low is broken then stay away from equities, invest in GOLD,Bank FD and Debt Funds, conservative traders(not investors) may go long above 5469.


Will update, as the prices unfolds>>>>>>>>>>

Please Feel free to share your suggestions, queries & questions either through comments or Mark a mail to buzzingnifty@gmail.com.

Wednesday, February 16, 2011

NIFTY CONTINUATION OF PATTERNS

NIFTY IS FOLLOWING A CONTINUATION IN THE PRICE PATTERN, ONLY THE PRICE RANGE SEEMS TO BE INCREASING.
1. FIBONACCI  PROJECTION SHOWS THE FALL FROM 6284 TO 5966 RETRACED 38.2%, TESTED THE BOTTOM, RETRACED ALMOST 100, ONLY TO FALL 138.2% TO 5690
2. THE SAME PATTERN WAS REPEATED FORM 6338 TO 5690 TO RETRACE 38.2% @ 6069 AGAIN TESTED THE NEWLY CREATED BOTTOM , ALMOST REACHED THE TOP BEFORE FALLING 138.2% TO 5177.
3. WILL NIFTY REPEAT THIS PATTERN AGAIN?????
    IF SO THEN NIFTY SHOULD REACH 5680 ODD LEVEL BEFORE FALLING. THIS ALSO           COINCIDES WITH OUR EW WAVE 4 TARGET, POSTED UNDER WEEKEND ANALYSIS.
   WILL POST DETAILED ANALYSIS ON THE ABOVE OBSERVATION AS THE PRICES UNFOLDS.

Popular Posts

NIFTY STOP AND REVERSE TRADING STRATEGY

NIFTY SAR(STOP AND REVERSE) FOR THE NEXT DAY IS POSTED ON DAILY BASIS ON FACEBOOK GROUP NIFTYHOLIC.

ALL VALUES ARE FOR SPOT NIFTY, TRADE THE FUTURES ACCORDINGLY

SAMPLE SAR

NIFTY SAR FOR 23RD MARCH 2011

SAR FOR 23RD MARCH,

SELL NIFTY BELOW 5405 AND GO LONG ABOVE 5430

IF HOLDS ON CLOSING BASIS

...

LAST TRADE

PART BOOKED @5385=120 POINTS OR 6000 RS.

CLOSED THE POSITION ON 22ND MARCH @5405=100 POINTS OR 5000 RS.

TOTAL PROFIT IN LAST TRADE WITH 2 LOTS=11000/-

AS ON 22ND MARCH

NIFTY RANGE FOR THE MARCH SERIES 5214.38 -- 5613.32

PCR INDEX OPTIONS-- 1.13(BEARISH)

INDIA VIX --22.26

SMR(smart Money Ratio)=16.73053(Bearish)


DISCLAIMER

Any action you choose to take in the markets is totally your own responsibility. Buzzingnifty™ will not be liable for any, direct or indirect, consequential or incidental damages or loss arising out of the use of this information. The services are based on technical analysis. They are neither an offer to sell nor solicitation to buy any of the securities mentioned herein. The writers may or may not be trading in the securities mentioned.